Answer:
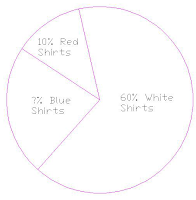
30% Blue Shirts
In order to solve this problem, the student must add the total percent of red shirts and white shirts produced and subtract that from 100%. The answer will give the total percent of blue shirts produced. The steps are as follows:
60 % white shirts + 10% red shirts = 70 % shirts out of the total
100 % total shirts – 70 % shirts produced = 30 % blue shirts that are produced.
© Copyright 2008.Najwa S. Hirn. All rights reserved
2 comments:
Math was my favorite subject when i was in school and now i get to teach my youngest boy whom i'm homeschooling. It's great that you're posting sample problems.
Thanks for the comment. It's great to find another math lover. Please email me at nshirn@yahoo.com if you need any math questions answered. I'll be happy to post a sample problem relating the specific area that you may need help with.
I salute you for homeschooling him !
Post a Comment